After reading my prior analysis on Vitamin A supplementation and life expectancy in Africa, you may have the following objections:
- Varying levels of cooking oil use
- Life expectancy too broad a metric
- Should factor in each country’s starting point
- Only references a single supplementation source
Ok, lets solve these issues by:
- Contrasting the “worst” countries to the strictest adherents
- Measuring vision, for which Vitamin A should be most impactful
- Looking only for the change in vision issues (Δ from 2010-2020)
- Including both capsule supplementation and cooking oil supplementation
We will use the following data sources:
World Economic Outlook (April 2024) – GDP per capita, current prices (imf.org)
Coverage at a Crossroads: New directions for Vitamin A supplementation programmes – UNICEF DATA
The Steps
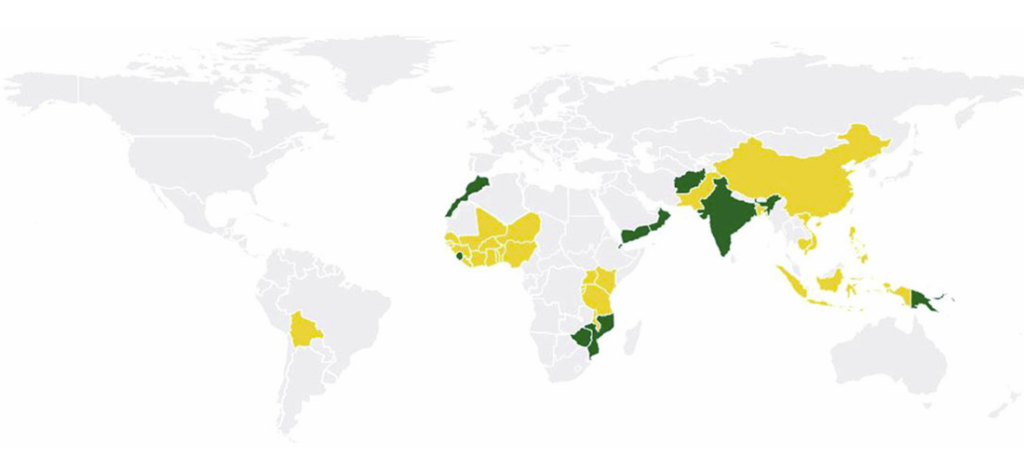
In the analysis we will overlap the capsule supplementation map with the oil supplementation map, then identify the greatest supplementers and the worst supplemented to compare. In other words, we will compare the countries only at the far ends of the spectrum, the starkest contrast.
Sierra Leone is in the “greatest supplementers” category because it includes both an 8-10 semester capsule coverage rate and oil supplementation with vitamin A. For Sierra Leone, the vision loss rate Δ for example, would be 18.3% – 17.6% = a 0.7% improvement from 2010 to 2020. The “worst supplemented” category would be the exact opposite, 0-2 semester coverage and no oil supplementation. The idea is to give vitamin A the benefit of the doubt/advantage in comparing it to the worst countries, Ethiopia and Lesotho.
Each country is weighted by population and normalized for GDP changes.

import pandas as pd
import numpy as np

# Define the data
data = {
    'Country': [
        'Mali', 'Guinea-Bissau', 'Sierra Leone', 'Ivory Coast', 'Burkina', 'Benin', 'Niger',
        'Mozambique', 'Tanzania', 'Ethiopia', 'Lesotho'
    ],
    'Vision Improvement 2010-2020': [
        0.8, 0.6, 0.7, 0.6, 0.4, 0.6, 0.5, 0.9, 1, 0.8, 0.8
    ],
    '2 dose VAS Coverage + Oil Supplementation': [
        1, 1, 1, 1, 1, 1, 1, 1, 1, 0, 0
    ],
    'GDP Per Capita Growth 2010-2020 %': [
        0.29, 0.67, 0.52, 0.48, 0.51, 0.46, 0.21, 0.33, 0.41, 1.48, 0.17
    ],
    'Population of total': [
        0.06516290967, 0.006016868724, 0.02459262303, 0.08077081219, 0.06504482099,
        0.03836092372, 0.07609853966, 0.09482608629, 0.188654597, 0.3539528752, 0.006518943507
    ]
}

# Create DataFrame
df = pd.DataFrame(data)

# Normalize GDP Growth by the maximum value to scale between 0 and 1
df['Normalized_GDP_Growth'] = df['GDP Per Capita Growth 2010-2020 %'] / df['GDP Per Capita Growth 2010-2020 %'].max()

# Calculate the weight as the product of population percentage and normalized GDP Growth
df['Weights'] = df['Population of total'] * df['Normalized_GDP_Growth']

# Function to calculate weighted average vision improvement
def weighted_average(group):
    if group['Weights'].sum() == 0:  # Avoid division by zero
        return np.nan
    return np.average(group['Vision Improvement 2010-2020'], weights=group['Weights'])

# Group by '2 dose VAS Coverage + oil supplementation' and apply weighted average
result = df.groupby('2 dose VAS Coverage + oil supplementation').apply(weighted_average)
print(result)
The Result
VAS Coverage + oil supplementation
0    0.800000
1    0.748654
dtype: float64

VAS Coverage + Oil Supplementation is negatively correlated with Vision Improvement 2010-2020
This negative correlation should again be very concerning to people. It seems that progress in vision improvement is due to factors related to increases in wealth, rather than anything to do with Vitamin A. This adds credibility to the idea that other nutrients are largely responsible for eye health, or at least that the guidelines regarding dosage are way too high, and possibly causing damage.


Leave a Reply