
Last Friday, I posted a TLT and BTC fractal indicating a rally through Q3. Today, we had some fake-out action, with slightly lower lows. The general structure is still in tact, and extra volatility should be expected in contrast to TLT along similar paths.
TLT/BTC Fractal Update
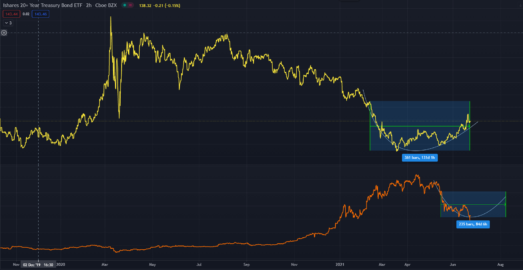
Below is the updated chart, with an estimated time scale added. This was calculated by taking samples from each chart, arriving a rough 0.65/1 ratio. If the fractal holds, we should return to $40,000 and beyond by August.

Market Symmetry Study
Traders may notice price action sometimes displays repeated patterns. One can take note of these patterns to mentally prepare for those repeated scenarios. This should include proper risk management along with positioning.
Below we can see the original May crash in BTC on the left and today’s price action on the right. We can descending broadening wedges on each side. There is also a domed shape in between, which showed pivotal support and resistance throughout.
We can note from this price action:
- Both wedges had breakouts to the downside, followed immediately by fake-outs to the upside
- If we repeat the movements shown after the first wedge, we should be open to the possibility of more consolidation, with a retest of the dome.
- Alternately, a break upwards out of the wedge, might signal an end to the fractal, an end to the accumulation phase and the beginning of a new secular uptrend.

TIPS
A bullish sign as of today’s close, inflation adjusted bonds broke out to the upside. In the near term, we can surmise that we may have a developing tailwind rather than a headwind, and macro risks to BTC should be low for the time being. Respectively, a breakdown of TIPS should switch bias back to risk aversion.

Leave a Reply