RSI Code
Pine Script version 5 strategy for TradingView with relative strength index (RSI) trading strategy is given in the first code. It is a chart overlay to help traders interpret market data and make better trade judgments by giving signals for entering a long position using RSI.
//@version=5

strategy("Normal RSI Strategy", overlay=true, initial_capital=100000, default_qty_type=strategy.percent_of_equity, default_qty_value=2)


// Inputs for strategy parameters

rsiLength = input.int(14, title="RSI Length")

rsiOverbought = input.int(70, title="RSI Overbought Level", minval=50, maxval=100)

rsiOversold = input.int(30, title="RSI Oversold Level", minval=0, maxval=50)


// Calculate the RSI

rsiVal = ta.rsi(close, rsiLength)


// Define the entry and exit conditions

enterLong = ta.crossover(rsiVal, rsiOversold)

exitLong = ta.crossunder(rsiVal, rsiOverbought)


// Execute the strategy

if (enterLong)

    strategy.entry("Buy", strategy.long)


if (exitLong)

    strategy.close("Buy")


// Plot RSI on the chart for visual reference

plot(rsiVal, "RSI", color=color.blue)

hline(rsiOverbought, "Overbought", color=color.red)

hline(rsiOversold, "Oversold", color=color.green)


// Plotting entry and exit points for clarity

bgcolor(enterLong ? color.new(color.green, 90) : na)

bgcolor(exitLong ? color.new(color.red, 90) : na)
RSI + Martingale Code
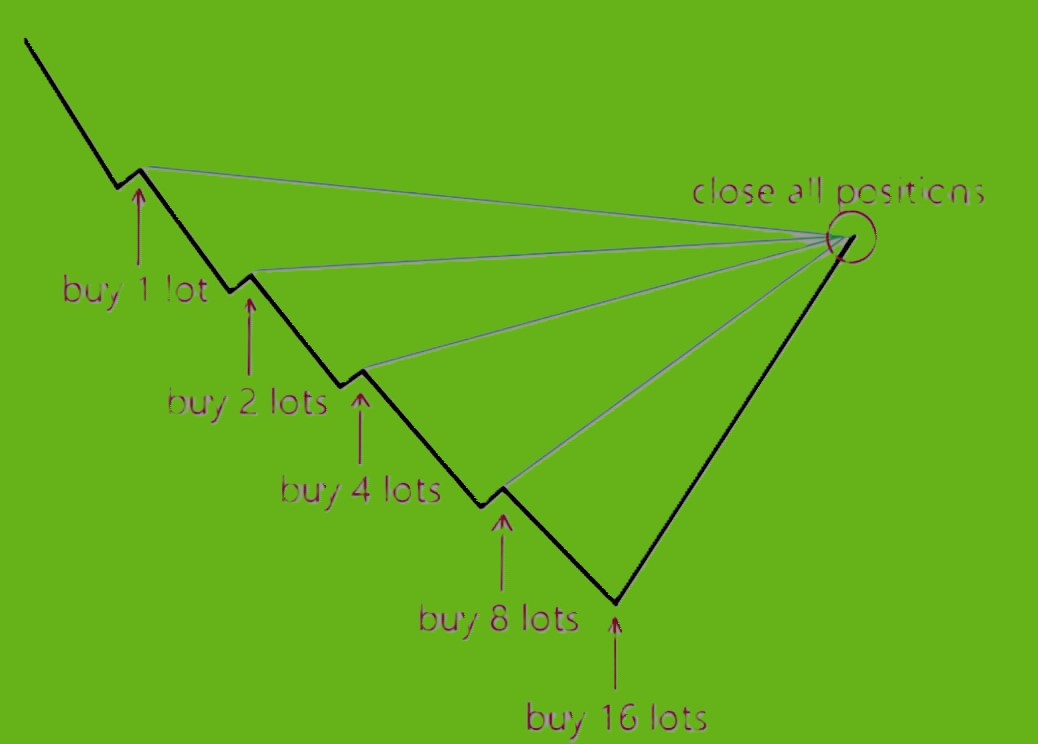
Now this code outlines a Martingale-enhanced RSI (Relative Strength Index) trading strategy using Pine Script v5. This strategy is designed for the TradingView platform, employing a Martingale betting system to adjust position sizes based on previous trade outcomes.
Martingale Position Sizing:
- The code implements a Martingale strategy for position sizing, where the position size is doubled after each loss until a winning trade occurs or the maximum number of consecutive losses is reached.
qtyToTrade: Variable to store the quantity of the asset to trade.consecutiveLosses: Tracks the number of consecutive losing trades.lastTradeProfit: A boolean flag indicating if the last trade was profitable.
//@version=5
strategy("Martingale Enhanced RSI Strategy", overlay=true)

// Define the parameters
rsiSource = close
rsiLength = 14
riskPerTrade = 0.02
accountBalance = 1000000
rsiOverbought = 70
rsiOversold = 30
maxConsecutiveLosses = 4

// Calculate the RSI
rsiVal = ta.rsi(rsiSource, rsiLength)

// Define the entry and exit conditions
enterLong = ta.crossover(rsiVal, rsiOversold)
exitLong = ta.crossunder(rsiVal, rsiOverbought)

// Martingale position sizing
var float qtyToTrade = 0
var int consecutiveLosses = 0
var bool lastTradeProfit = true

if (enterLong)
    if (lastTradeProfit)
        qtyToTrade := math.floor(accountBalance * riskPerTrade / (high - low))
        consecutiveLosses := 0
    else
        if (consecutiveLosses < maxConsecutiveLosses)
            qtyToTrade := qtyToTrade * 2  // Double the position size after each loss
        else
            qtyToTrade := math.floor(accountBalance * riskPerTrade)
        consecutiveLosses := consecutiveLosses + 1

    strategy.entry("Buy", strategy.long, qty=qtyToTrade)

if (exitLong)
    strategy.close("Buy")
    lastTradeProfit := false

// Reset position sizing after a winning trade
if (strategy.closedtrades > 0)
    lastTradeProfit := true
    consecutiveLosses := 0
    qtyToTrade := math.floor(accountBalance * riskPerTrade)

// Plot RSI on the chart
plot(rsiVal, "RSI", color=color.blue)
hline(rsiOverbought, "Overbought", color=color.red)
hline(rsiOversold, "Oversold", color=color.green)

Bollinger Bands + Martingale
Next up we’ll take a bollinger band strategy and apply martingale position sizing.
Martingale Position Sizing Logic
- A variable to track the percentage of equity risked (
martingaleRisk) is adjusted daily. If the trade loses, the risk percentage for the next trade is doubled, adhering to the Martingale principle. - The risk is capped at 50% to prevent excessive exposure, a critical safeguard to mitigate the risk of significant drawdowns.
//@version=5

strategy("Bollinger Bands Martingale Strategy - Corrected", overlay=true, initial_capital=100000)


// Inputs for strategy parameters

length = input.int(20, title="Length")

mult = input.float(2.0, title="Multiplier")

initialRisk = input.float(2, title="Initial Risk Percentage", minval=0.1, maxval=10)


// Bollinger Bands calculation

basis = ta.sma(close, length)

dev = mult * ta.stdev(close, length)

upper = basis + dev

lower = basis - dev


// Plot Bollinger Bands

plot(basis, "Basis", color=color.blue)

plot(upper, "Upper Band", color=color.red)

plot(lower, "Lower Band", color=color.green)


// Martingale position sizing variables

var float martingaleRisk = initialRisk

var int lastTradeDay = na


// Reset martingaleRisk at the beginning of each day

if (dayofmonth != lastTradeDay)

    martingaleRisk := initialRisk

    lastTradeDay := dayofmonth


// Entry conditions

enterLong = ta.crossover(close, lower)

enterShort = ta.crossunder(close, upper)


// Exit conditions

exitLong = ta.crossover(close, basis)

exitShort = ta.crossunder(close, basis)


// Strategy execution with martingale position sizing logic

if (enterLong)

    strategy.entry("Long", strategy.long, qty=strategy.equity * martingaleRisk / 100 / close)

    martingaleRisk := martingaleRisk * 2 // Increase risk for next trade


if (enterShort)

    strategy.entry("Short", strategy.short, qty=strategy.equity * martingaleRisk / 100 / close)

    martingaleRisk := martingaleRisk * 2 // Increase risk for next trade


if (exitLong)

    strategy.close("Long")


if (exitShort)

    strategy.close("Short")


// Cap the martingaleRisk to prevent excessive exposure

martingaleRisk := math.min(martingaleRisk, 50)


Leave a Reply